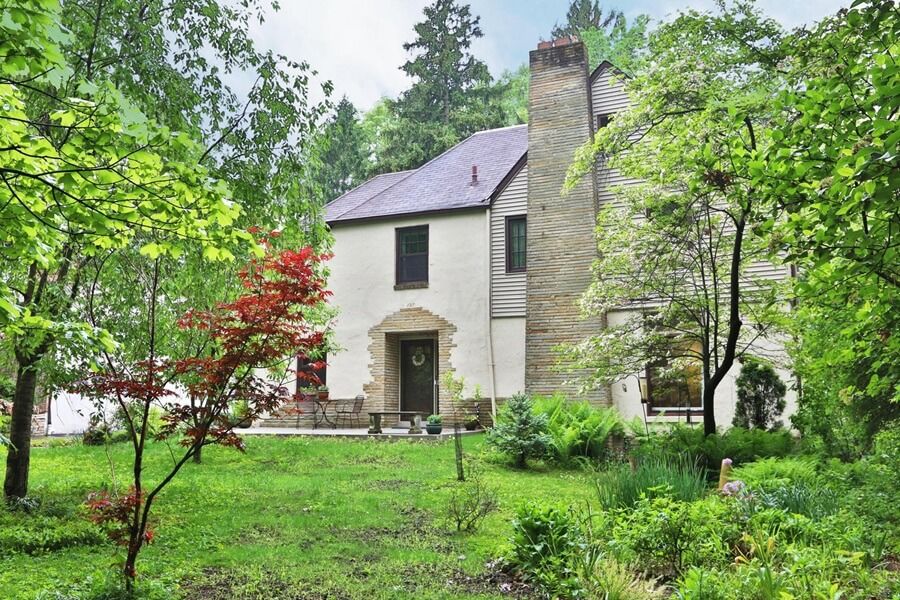
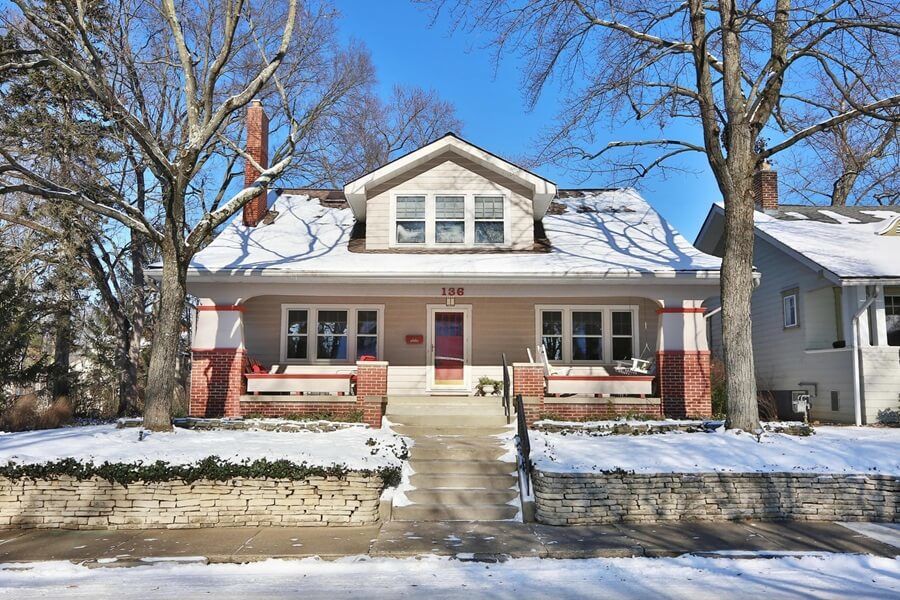
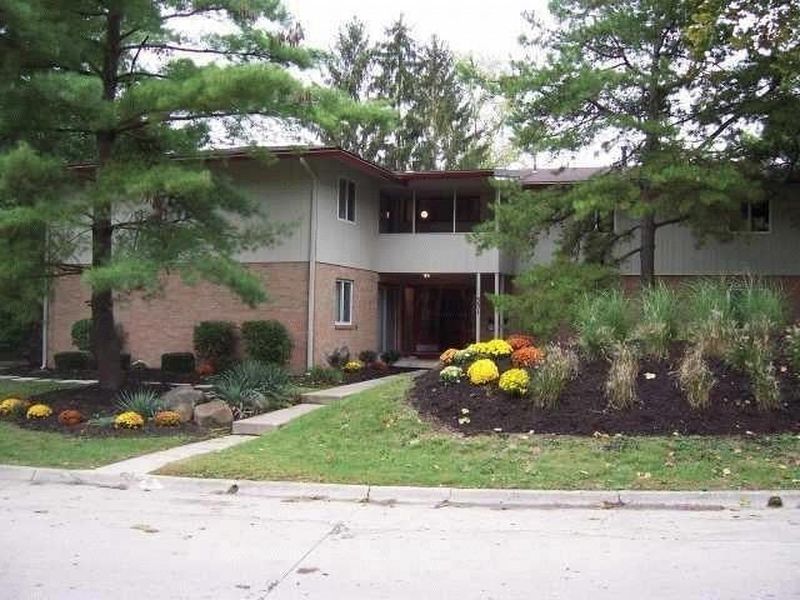
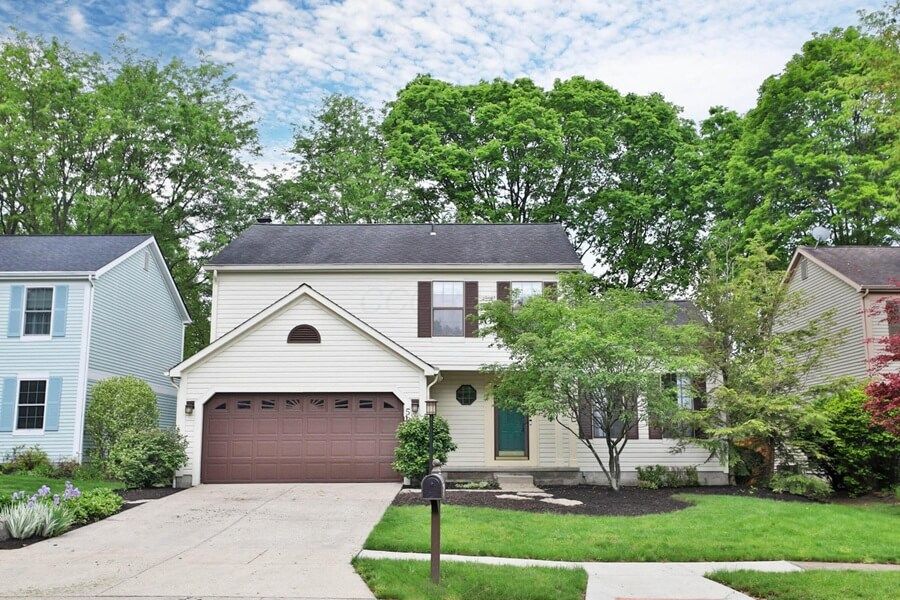
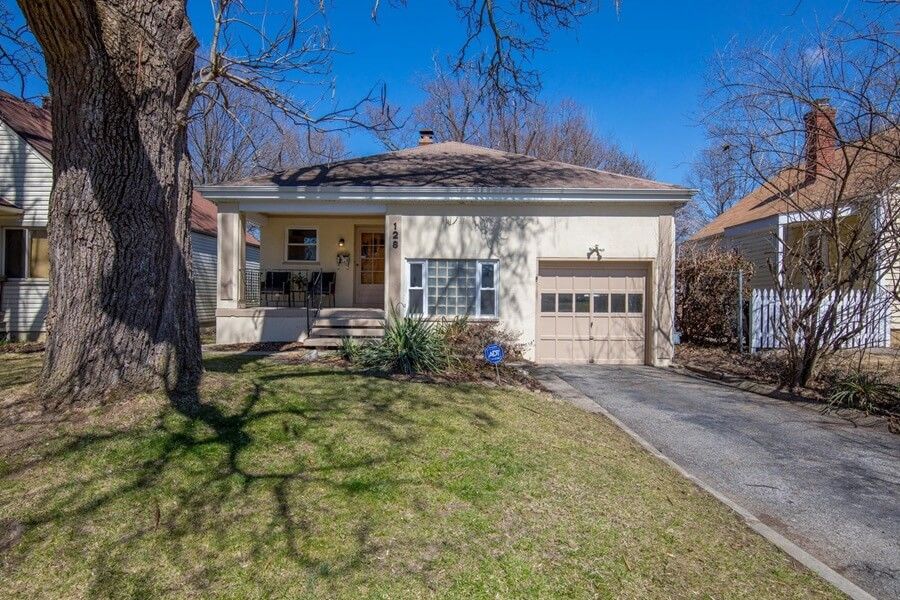
Find Your Place in Clintonville
Clintonville isn’t one single “vibe”—it’s a collection of walkable pockets, each with its own feel. From classic streets lined with character homes to quieter corners near parks and local favorites, this page helps you explore what makes each area unique and find the best match for your lifestyle.
The table below offers a side-by-side comparison of key real estate metrics from recent sales, including pricing ranges, home sizes, architectural styles, days on market, and common features such as garages and basements. These data points help illustrate how each neighborhood performs and what buyers can expect depending on where they choose to focus.
This comparison is designed as a starting point. Numbers tell part of the story, but understanding how a neighborhood feels—its streets, homes, and surroundings—is just as important. If you’d like help interpreting this data or exploring which neighborhood best fits your goals, I’m happy to guide you.
| Based Upon 2025 Sales | Neighbourhoods | |||||||
| Beechwold | Clintonville | Delawanda | Glenburn | Highfield & Fenway | Sharon Heights | Sharon Township | ||
| House Sales | Quantity | 125 | 190 | 7 | 3 | 2 | 34 | 18 |
| Original List Price | Highest | $1,200,000 | $1,732,400 | $379,800 | $399,900 | $479,900 | $525,000 | $425,000 |
| Lowest | $179,900 | $235,000 | $149,900 | $369,000 | $299,900 | $264,900 | $100,000 | |
| Average | $475,019 | $497,960 | $292,657 | $381,600 | $389,950 | $361,712 | $262,416 | |
| Median | $430,000 | $474,900 | $315,000 | $375,900 | $389,950 | $349,500 | $304,500 | |
| Sale Price | Highest | $1,155,000 | $1,489,850 | $375,000 | $401,000 | $459,900 | $512,500 | $400,000 |
| Lowest | $194,700 | $240,000 | $155,777 | $375,900 | $316,000 | $265,000 | $160,640 | |
| Average | $469,416 | $491,984 | $277,100 | $392,300 | $387,950 | $364,598 | $296,582 | |
| Median | $425,000 | $463,050 | $297,500 | $400,000 | $387,950 | $347,000 | $305,000 | |
| Number of Bedrooms | High | 5.0 | 6.0 | 3.0 | 4.0 | 3.0 | 5.0 | 4.0 |
| Low | 2.0 | 2.0 | 2.0 | 3.0 | 2.0 | 2.0 | 2.0 | |
| Average | 3.0 | 3.1 | 2.4 | 3.3 | 2.5 | 2.8 | 2.4 | |
| Median | 3.0 | 1.0 | 2.0 | 3.0 | 2.5 | 3.0 | 2.0 | |
| Number of Bathroom | High | 4.0 | 4.2 | 2.0 | 2.0 | 2.0 | 3.1 | 3.1 |
| Low | 1.0 | 1.0 | 1.0 | 2.0 | 1.0 | 1.0 | 1.0 | |
| Average | 2.1 | 2.2 | 1.1 | 2.0 | 1.5 | 1.9 | 1.6 | |
| Median | 2.0 | 2.0 | 1.0 | 2.0 | 1.5 | 2.0 | 1.0 | |
| Square Footage | High | 3,437 | 5,680 | 1,307 | 1,434 | 1,804 | 2,130 | 1,676 |
| Low | 732 | 734 | 576 | 1,365 | 952 | 708 | 656 | |
| Average | 1,452 | 1,582 | 960 | 1,393 | 1,378 | 1,255 | 1,008 | |
| Median | 1,336 | 1,545 | 1,012 | 1,379 | 1,378 | 1,223 | 1,010 | |
| Dollars/Sq. Ft. | High | $528 | $536 | $307 | $293 | $331 | $404 | $483 |
| Low | $192 | $125 | $243 | $272 | $254 | $212 | $199 | |
| Average | $330 | $316 | $287 | $281 | $293 | $303 | $306 | |
| Median | $329 | $314 | $292 | $279 | $293 | $308 | $291 | |
| Style | One-floor | 53 | 20 | 2 | 0 | 1 | 15 | 10 |
| Cape Cod | 34 | 31 | 5 | 2 | 1 | 5 | 4 | |
| Two, 2.5 & 3 floors | 38 | 137 | 0 | 1 | 0 | 8 | 4 | |
| Other | 0 | 2 | 0 | 0 | 0 | 4 | 0 | |
| Year Built | Oldest | 1900 | 1883 | 1940 | 1947 | 1948 | 1915 | 1910 |
| Youngest | 2004 | 1961 | 1951 | 1954 | 1952 | 2019 | 2019 | |
| Average | 1947 | 1930 | 1942 | 1950 | 1950 | 1957 | 1949 | |
| Median | 1947 | 1927 | 1940 | 1950 | 1950 | 1955 | 1948 | |
| Days on Market | High | 153 | 367 | 219 | 10 | 33 | 82 | 99 |
| Low | 1 | 1 | 5 | 3 | 3 | 1 | 1 | |
| Average | 21 | 21 | 75 | 6 | 18 | 10 | 22 | |
| Median | 7 | 5 | 42 | 7 | 18 | 5 | 7.5 | |
| Garage? | % Yes | 89.6 | 87.9 | 71.4 | 100 | 50.0 | 73.5 | 88.9 |
| % No | 10.4 | 12.1 | 28.6 | 0.0 | 50.0 | 26.5 | 11.1 | |
| Basement? | % Yes | 98.4 | 97.4 | 85.7 | 100 | 100 | 88.2 | 88.9 |
| % No | 1.6 | 2.6 | 14.3 | 0.0 | 0.0 | 11.8 | 11.1 | |
| Based Upon 2025 Sales | Neighbourhoods | |||||||
| Beechwold | Clintonville | Delawanda | Glenburn | Highfield & Fenway | Sharon Heights | Sharon Township | ||
| Condo Sales | Quantity | 1 | 5 | 0 | 0 | 11 | 0 | 0 |
| Original List Price | Highest | $268,000 | $379,900 | - | - | $335,000 | - | - |
| Lowest | $268,000 | $200,000 | - | - | $159,000 | - | - | |
| Average | $268,000 | $287,980 | - | - | $256,973 | - | - | |
| Median | $268,000 | $320,000 | - | - | $285,000 | - | - | |
| Sale Price | Highest | $250,000 | $342,000 | - | - | $320,000 | - | - |
| Lowest | $250,000 | $190,000 | - | - | $158,000 | - | - | |
| Average | $250,000 | $276,400 | - | - | $248,000 | - | - | |
| Median | $250,000 | $310,000 | - | - | $285,000 | - | - | |
| Number of Bedrooms | High | 2 | 3 | - | - | 3 | - | - |
| Low | 2 | 2 | - | - | 2 | - | - | |
| Average | 2.0 | 2.4 | - | - | 2.50 | - | - | |
| Median | 2.0 | 2.0 | - | - | 2.0 | - | - | |
| Number of Bathroom | High | 1.5 | 2.1 | - | - | 2.5 | - | - |
| Low | 1.5 | 1.0 | - | - | 1.0 | - | - | |
| Average | 1.5 | 1.9 | - | - | 2.3 | - | - | |
| Median | 1.5 | 2.0 | - | - | 2.5 | - | - | |
| Square Footage | High | 1,018 | 1,584 | - | - | 2,502 | - | - |
| Low | 1,018 | 896 | - | - | 889 | - | - | |
| Average | 1,018 | 1,250 | - | - | 1,561 | - | - | |
| Median | 1,018 | 1,245 | - | - | 1,550 | - | - | |
| Dollars/Sq. Ft. | High | $245 | $261 | - | - | $189 | - | - |
| Low | $245 | $195 | - | - | $119 | - | - | |
| Average | $245 | $222 | - | - | $164 | - | - | |
| Median | $245 | $219 | - | - | $166 | - | - | |
| Style | One-floor | 0 | 1 | - | - | 4 | - | - |
| Cape Cod | 0 | 0 | - | - | 0 | - | - | |
| Two, 2.5 & 3 floors | 1 | 4 | - | - | 5 | - | - | |
| Other | 0 | 0 | - | - | 2 | - | - | |
| Year Built | Oldest | 1931 | 1953 | - | - | 1964 | - | - |
| Youngest | 1931 | 2009 | - | - | 1996 | - | - | |
| Average | 1931 | 1987 | - | - | 1975 | - | - | |
| Median | 1931 | 1999 | - | - | 1978 | - | - | |
| Days on Market | High | 17 | 58 | - | - | 134 | - | - |
| Low | 17 | 2 | - | - | 6 | - | - | |
| Average | 17 | 17 | - | - | 30 | - | - | |
| Median | 17 | 8 | - | - | 12 | - | - | |
| Garage? | % Yes | 100 | 60 | - | - | 91.0 | - | - |
| % No | 0 | 40 | - | - | 9.0 | - | - | |
| Basement? | % Yes | 100 | 40 | - | - | 36.4 | - | - |
| % No | 0 | 60 | - | - | 63.6 | - | - | |